


byRituparna Nath Content Writer at Study Abroad Exams
PTE Score Chart provides a comprehensive and consistent way to evaluate all of the abilities examined in the test. PTE score chart is the overall assessment of-Grammar, oral fluency, pronunciation, spelling, vocabulary, writing abilities, and communication skills. With PTE score a candidate receives accurately reflects their English skills and is calculated using the Global scoring scale ranging from 10-90. This constant method of rating, colleges, and immigration requirements helps candidates to determine their selection of colleges.
| Table of Contents |
What is PTE Score Chart?
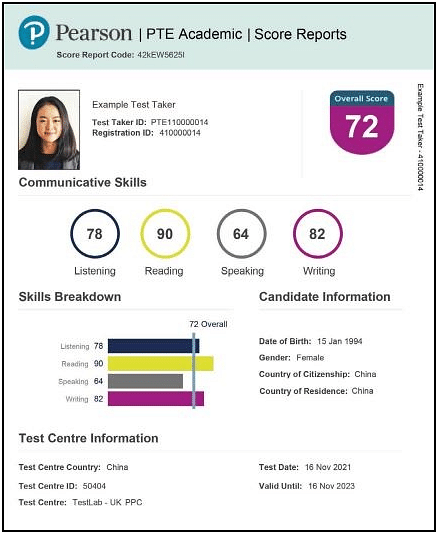
Evaluation of PTE scoring is a challenging task. PTE score is a sum and average of skills that are assessed in PTE exam pattern. Pearson PTE score chart is evaluated based on grammar, oral fluency, pronunciation, spelling, vocabulary, written skills, and PTE communicative skills with PTE score range from 10-90. Here is the sample of the PTE test score chart:
PTE Score Chart Evaluation
Candidates are confused over what is a good PTE score. Each section of PTE test; PTE speaking, PTE writing, PTE listening, and PTE reading has a certain level of excellence and marks are given accordingly. These can be compared by candidates on the basis of PTE score chart. Below mentioned table highlights the same and an easy understanding of new PTE score band chart can be established by candidates:
| PTE Scores | Level of Excellence |
|---|---|
| 30 – 36 | Limited |
| 36 – 43 | Modest |
| 43 – 50 | Modest |
| 50 – 58 | Competent |
| 58 – 65 | Competent |
| 65 – 79 | Good |
| 79 – 86 | Very Good |
| 86 – 90 | Expert |
With the above-mentioned PTE score table, candidates can evaluate their level of excellence by comparing their respective scores. Also, they will be able to understand the PTE band chart as well for dedicated band scores.
PTE, IELTS and TOEFL Score Comparison
To calculate PTE academic overall score, first, the average of the enabling skills (grammar, oral fluency, pronunciation, spelling, vocabulary, and written discourse) is calculated.
The communicative skills have 4 components and the average of enabling skills is used as the 5th component here. This average may have decimals in it which is rounded off to the next full number. This is the Overall PTE score chart with IELTS. Candidates to get an in-depth insight can take help from PTE score calculator.
While comparing PTE to IELTS, candidates should understand that both the tests have different layouts and scoring methodologies. IELTS assigns bands of 1-8 to candidates, whereas PTE assigns numerical marks out of 90. Provided below is a table that highlights comparison of PTE score chart latest 2023 with IELTS band and TOEFL scores:
| PTE Scores | TOEFL Scores | IELTS Band | Level of Excellence |
|---|---|---|---|
| 0 to 30 | 0 to 31 | 0 to 4 | Extremely Limited |
| 30 to 34 | 32 to 34 | 4.5 | Limited |
| 35 to 41 | 35 to 45 | 5 | Modest |
| 42 to 49 | 46 to 59 | 5.5 | Modest |
| 50 to 57 | 60 to 78 | 6 | Competent |
| 58 to 63 | 79 to 93 | 6.5 | Competent |
| 64 to 72 | 94 to 101 | 7 | Good |
| 73 to 77 | 102 to 109 | 7.5 | Good |
| 78 to 82 | 110 to 114 | 8 | Very Good |
| 83 to 85 | 115 to 117 | 8.5 | Very Good |
| 86 to 90 | 118 to 120 | 9 | Expert |
With the help of this PTE marks chart, IELTS and TOEFL score chart, it is now easy to represent PTE score chart with band scores of IELTS and TOEFL. Candidates can compare PTE marks distribution chart 2023 with IELTS and TOEFL scores and understand the equivalent scores of their obtained PTE points from PTE marks chart.
How PTE Overall Score is Calculated?
Candidates must have by now understood the concept of marks chart. PTE score calculation is accomplished based on the results of candidates in all the section of PTE test. The PTE scores are calculated based on communicative skills and enabling scores of the candidates. Below mentioned point provides a brief about PTE overall score calculator:
- Communication Skills: Checks the candidate’s reading, writing, listening and speaking skills, and the scores of the communicative range between 10 to 90 points.
- Enabling Score: Checks the pronunciation, oral fluency, vocabulary, and written discourse, the scores of the enabling scores also ranges between 10 to 90 points.
PTE Score Chart for Speaking and Writing
This will highlight the PTE marks distribution chart 2021 along with question type, time allowed, number of questions, scoring and skills that are assessed for PTE scores.
| Question type | Time allowed | Number of items | Scoring | Communicative skills, enabling skills, and other traits scored |
|---|---|---|---|---|
| Read aloud | 30-35 minutes | 6-7 | Partial credit | Reading and speaking Oral fluency, pronunciation Content |
| Repeat sentence | 10-12 | Partial credit | Listening and speaking Oral fluency, pronunciation Content | |
| Describe image | 6-7 | Partial credit | Speaking Oral fluency, pronunciation Content | |
| Re-tell lecture | 3-4 | Partial credit | Listening and speaking Oral fluency, pronunciation, and content | |
| Answer short question | 10-12 | Correct/ incorrect | Listening and speaking Vocabulary | |
| Summarise written text | 20-30 minutes | 2-3 | Partial credit | Reading and writing Grammar, vocabulary Content, form |
| Write essay | 20-40 minutes | 1-2 | Partial credit | Writing Grammar, vocabulary, spelling, written discourse Content; development, structure and coherence; form, general linguistic range |
PTE Score for Reading Section
This list will highlight PTE score chart 2023 details for PTE reading section:
| Question type | Time allowed | Number of items | Scoring | Communicative skills, enabling skills, and other traits scored |
|---|---|---|---|---|
| Multiple-choice answer | 32-41 minutes | 2-3 | Correct/ incorrect | Reading |
| Multiple-choice answers | 2-3 | Partial credit (for each correct response. Points deducted for incorrect options chosen) | Reading | |
| Re-order paragraphs | 2-3 | Partial credit (for each correctly ordered, adjacent pair) | Reading | |
| Reading: Fill in the blanks | 4-5 | Partial credit (for each correctly completed blank) | Reading | |
| Reading and writing: Fill in the blanks | 5-6 | Partial credit (for each correctly completed blank) | Reading and writing |
PTE Score Chart for Listening Section
Below mentioned table highlights the PTE latest score chart list for PTE listening:
| Item type | Time allowed | Number of items | Scoring | Communicative skills, enabling skills, and other traits scored |
|---|---|---|---|---|
| Summarise spoken text | 20-30 minutes | 2-3 | Partial credit | Listening and writing Grammar, vocabulary, spelling Content, form |
| Multiple–choice answers | 23-28 minutes | 2-3 | Partial credit (for each correct response. Points deducted for incorrect options chosen) | Listening |
| Fill in the blanks | 2-3 | Partial credit (each correct word spelled correctly) | Listening and writing | |
| Highlight correct summary | 2-3 | Correct/ incorrect | Listening and reading | |
| Multiple-choice, choose single answer | 2-3 | Correct/ incorrect | Listening | |
| Select missing word | 2-3 | Correct/ incorrect | Listening | |
| Highlight incorrect words | 2-3 | Partial credit (for each word. Points deducted for incorrect options chosen) | Listening and reading | |
| Write from dictation | 3-4 | Partial credit (for each word spelled correctly) | Listening and writing |
This PTE band score chart is also known as the PTE score distribution chart. As it is seen in this PTE score chart with band that PTE communicative skills scores have two different scoring systems – correct/incorrect and partial credit. This will be further utilised as a PTE new score chart. Let us understand it in detail about latest PTE score chart:
For correct/incorrect questions, the correct answers receive a full point and the wrong ones are scored as zero. For the partial credit system, a certain point gets deducted for each wrong answer. The sectional scores are calculated by adding the score obtained incorrect/incorrect questions and partial credit questions. These will be potentially applicable to the PTE new score chart.
Breakdown of PTE Score Range
Candidates might have confusion regarding the skills evaluation of the PTE score chart latest 2023 that they have been allotted with. A detailed breakdown of each score range in the new score chart of PTE speaking, PTE writing, PTE listening, and PTE reading have been provided. Candidates can frame an average PTE band score chart concept respectively:
| PTE Score Range | Skills Evaluated |
|---|---|
| 10-29 | Use of basic phrases bty candidates and everyday expressions. Basic introductory and interaction skills. |
| 30-42 | Skills to discuss relevant topics. Usage of daily phrases and expressions. Better interaction approach and sharing of basic personal information. |
| 43-50 | Understanding of standard language and ability to explain experiences. Ability to provide opinion over general topics. |
| 51-58 | Good hold over languages skills. Ability to share factual information based on everyday life experiences. Skills to record and broadcast information. |
| 59-75 | Fluency with communication and interaction with other people with negligible errors. Ability to highlight major information associated with a given topic. |
| 75-84 | Ability to understand a range of complex texts and highlight major ideas related to the topic. Effective communication skills and ability to describe themselves potentially. |
| Above 85 | Expert level of communication skills. Ability to understand information from various sources. Presence of clarity within their explanation. |
Who Accepts PTE Scores?
There are a number of countries globally where PTE scores are accepted for the purpose of migration and student visa. These countries have been provided below accepts PTE score chart:
| Australia | New Zealand | China | Austria |
| Canada | USA | South Korea | South Africa |
| Bulgaria | Indonesia | Estonia | Singapore |
| Hong Kong | Taiwan | Japan | Finland |
| Vietnam | Ireland | Egypt | France |
| Spain | Sri Lanka | Thailand | Saudi Arabia |
| Germany | Turkey | Greece | Norway |
| UAE | Sweden | Oman | Iraq |
| Jordan | Bangladesh | Nepal | Israel |
With appropriate PTE score, candidates can apply for visa and migration in the above mentioned countries. Prior to this, candidates must check the PTE Score chart requirements for each country.
*The article might have information for the previous academic years, which will be updated soon subject to the notification issued by the University/College.


Comments